Dr. Dominic Royé
home
blog
publications
graphs
me
visualization
Use of multidimensional spatial data
Space-time information is vital in many disciplines, especially in climatology or meteorology, and this makes it necessary to have a format that allows a multidimensional structure. It is also important that this format has a high degree of interchange compatibility and can store a large number of data.
2022-03-08
12 min read
gis
,
R
,
R:advanzed
,
visualization
Visualize the day-night cycle on a world map
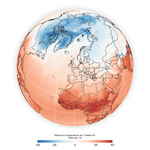
In April of this year, I made an animation of the 24-hour average temperature of January 2020, also showing the day-night cycle. My biggest problem was finding a way to project correctly the area at night without breaking the geometry. The easiest solution I found was rasterising the night polygon and then reprojecting it. Indeed, a vector approach could be used, but I have preferred to use raster data here.
2021-12-20
8 min read
gis
,
R
,
R:intermediate
,
visualization
Climate circles
The climate of a place is usually presented through climographs that combine monthly precipitation and temperature in a single chart. However, it is also interesting to visualize the climate on a daily scale showing the thermal amplitude and the daily average temperature. To do this, the averages for each day of the year of the daily minimums, maximums and averages are calculated. The annual climate cycle presents a good opportunity to use a radial or polar which allows us to clearly visualize seasonal patterns.
2021-09-04
7 min read
R
,
R:elementary
,
visualization
Firefly cartography
Firefly
maps are promoted and described by
John Nelson
who published a
post
in 2016 about its characteristics. However, these types of maps are linked to ArcGIS, which has led me to try to recreate them in R.
2021-06-01
8 min read
gis
,
R
,
R:intermediate
,
visualization
Bivariate dasymetric map
A disadvantage of choropleth maps is that they tend to distort the relationship between the true underlying geography and the represented variable. It is because the administrative divisions do not usually coincide with the geographical reality where people live. Besides, large areas appear to have a weight that they do not really have because of sparsely populated regions. To better reflect reality, more realistic population distributions are used, such as land use. With Geographic Information Systems techniques, it is possible to redistribute the variable of interest as a function of a variable with a smaller spatial unit.
2021-03-01
7 min read
gis
,
R
,
R:advanced
,
visualization
»
Cite
×