# install the lubridate and tidyverse libraries
if (!require("tidyverse")) install.packages("tidyverse")

# packages
library(tidyverse)
library(RColorBrewer)

# import the annual temperatures
temp_lisboa <- read_csv("temp_lisboa.csv")

str(temp_lisboa)How to create ‘Warming Stripes’ in R
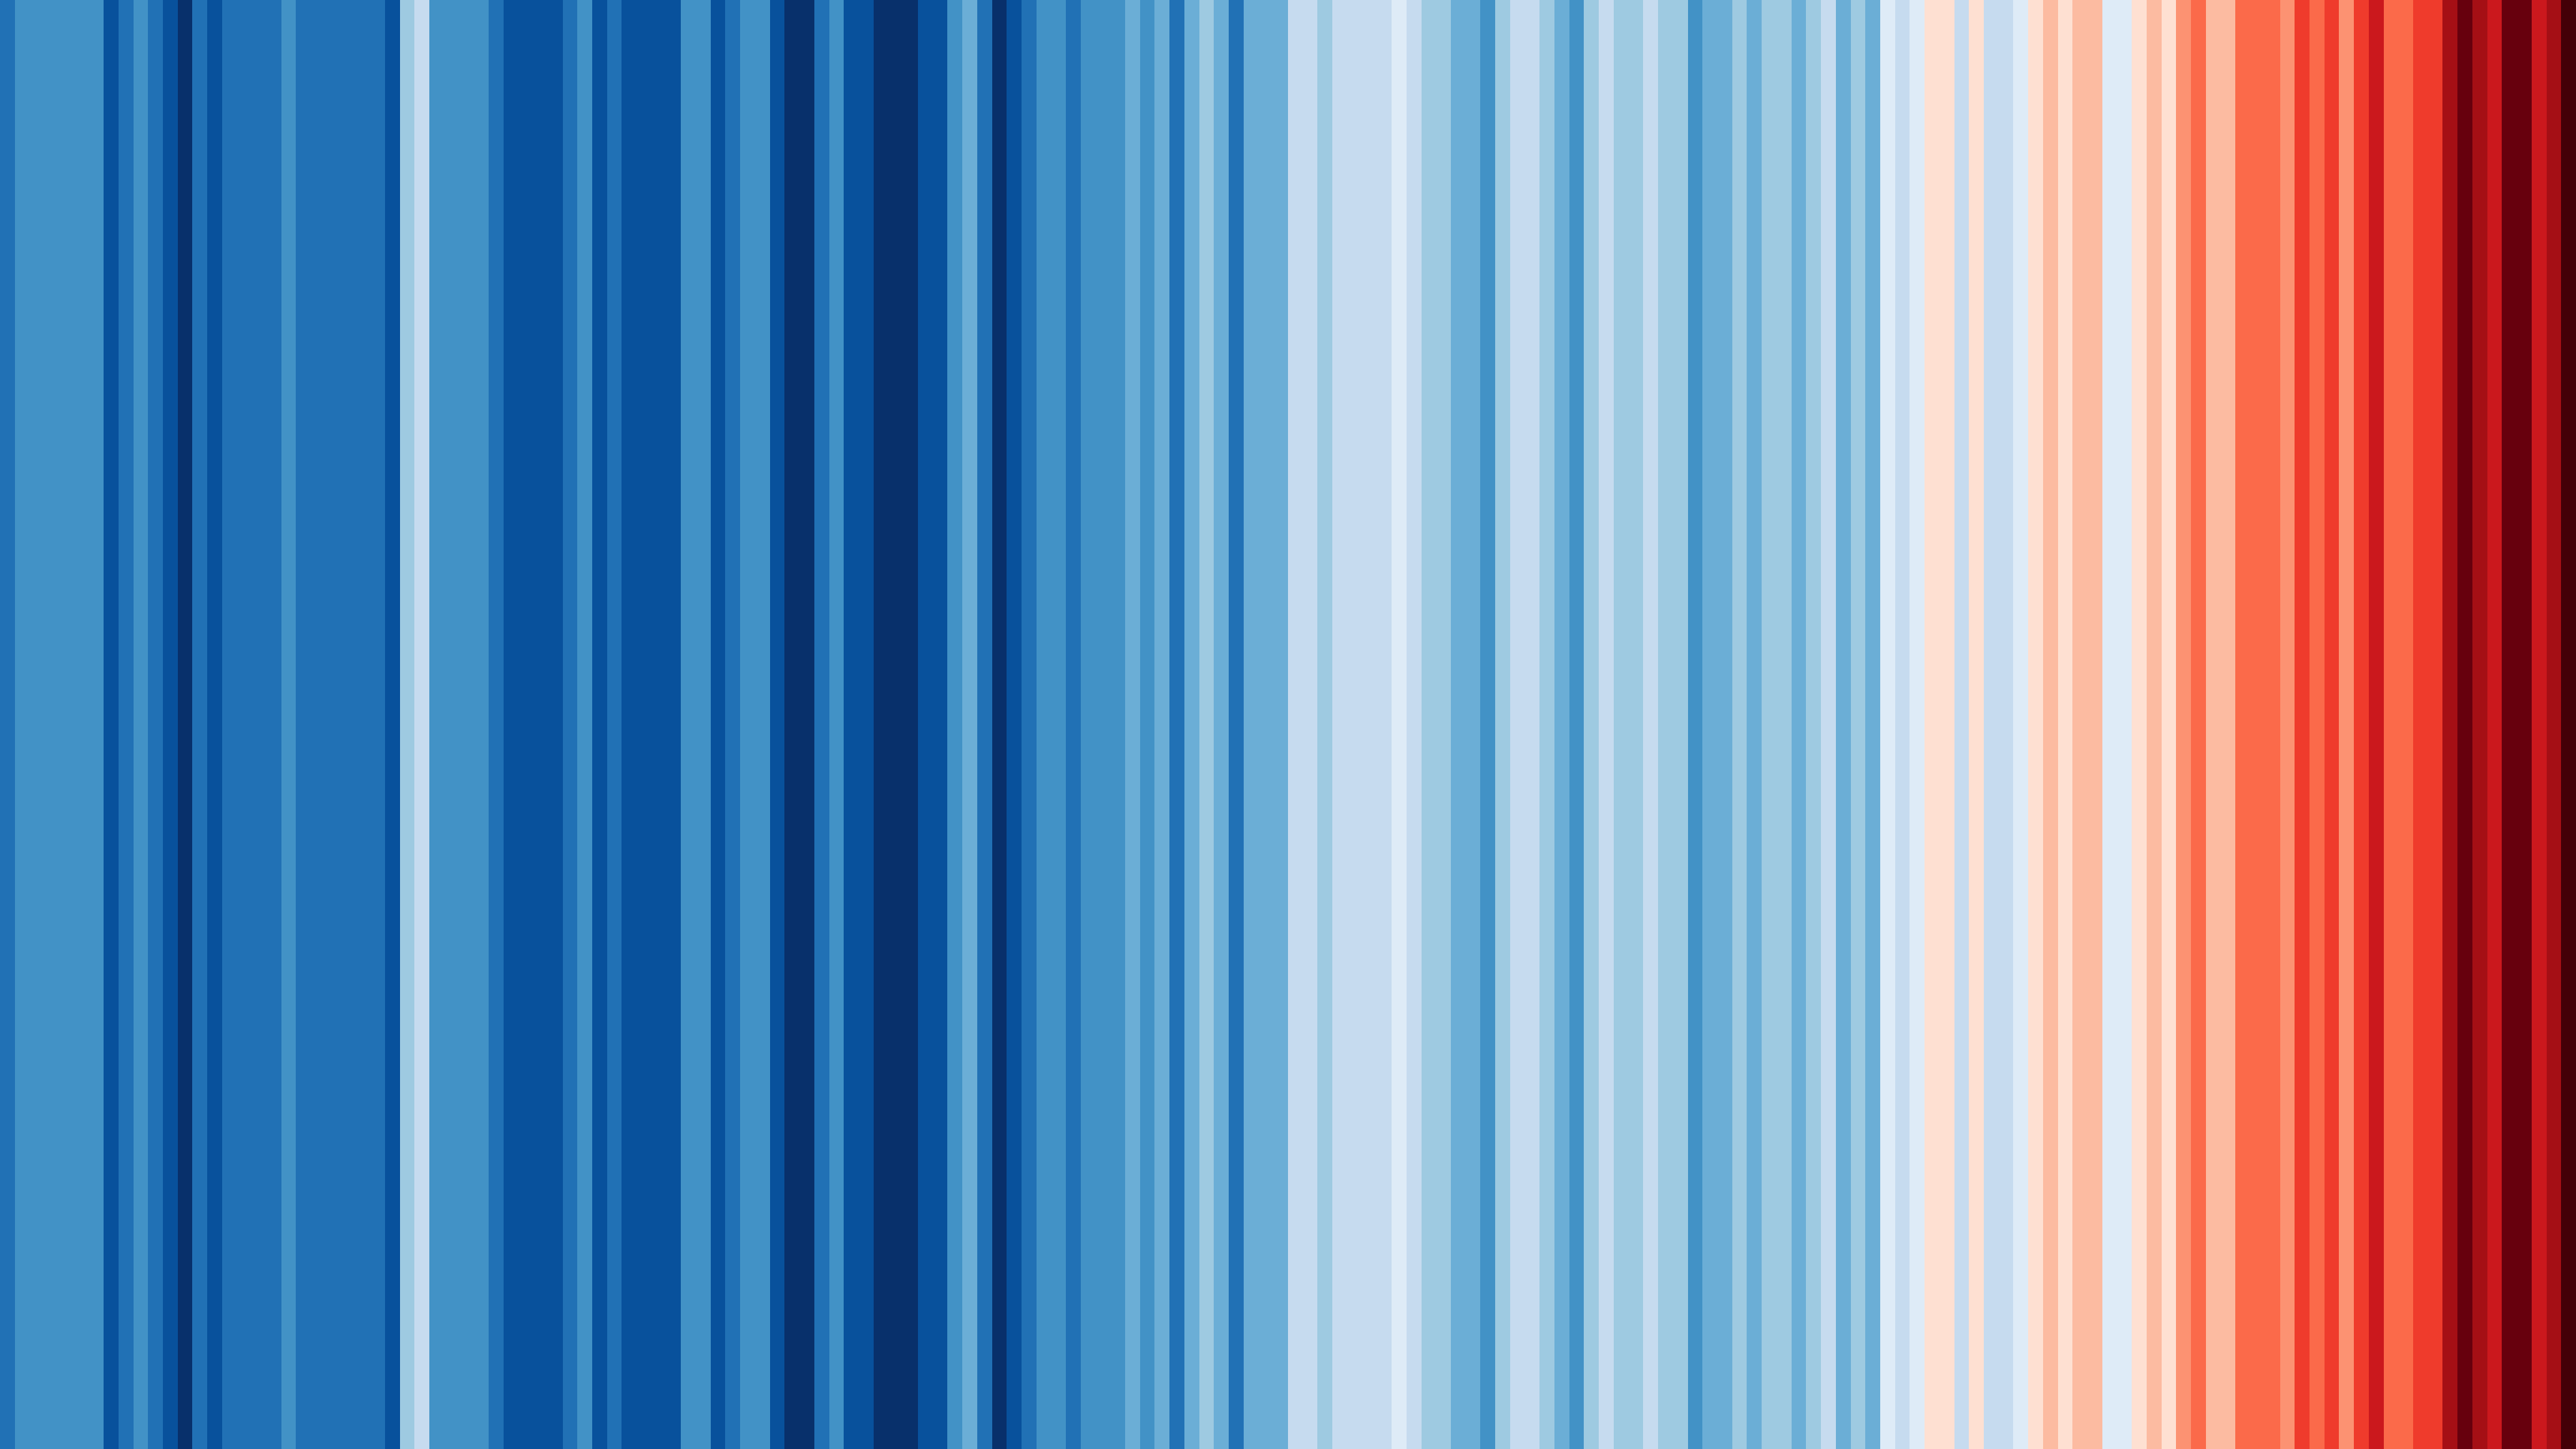
This year, the so-called warming stripes, which were created by the scientist Ed Hawkins of the University of Reading, became very famous all over the world. These graphs represent and communicate climate change in a very illustrative and effective way.
In this post I will show how you can create these strips in R with the ggplot2 library. Although I must say that there are many ways in R that can lead us to the same result or to a similar one, even within ggplot2.
Data
In this case we will use the annual temperatures of Lisbon GISS Surface Temperature Analysis, homogenized time series, comprising the period from 1880 to 2018. Monthly temperatures or other time series could also be used. The file can be downloaded here. First, we should, as long as we have not done it, install the collection of tidyverse packages that also include ggplot2. Then, we import the data of Lisbon in csv format.
We see in the columns that we have monthly and seasonal values, and the annual temperature value. But before proceeding to visualize the annual temperature, we must replace the missing values 999.9 with NA, using the ifelse() function that evaluates a condition and perform the given argument corresponding to true and false.
When we use the year as a variable, we do not usually convert it into a date object, however it is advisable. This allows us to use the date functions of the lubridate package and the support functions inside of ggplot2. The str_c() function of the library stringr, part of the collection of tidyverse, is similar to paste() of R Base that allows us to combine characters by specifying a separator (sep = “-”). The ymd() (year month day) function of the lubridate package converts a date character into a Date object. It is possible to combine several functions using the pipe operator %>% or |> that helps to chain without assigning the result to a new object. The first pipe in R was %>% very extended especially within the tidyverse package collection. If you want to know more about its use, you can find here a tutorial or some details on differences between both here.
Creating the strips
First, we create the style of the graph, specifying all the arguments of the theme we want to adjust. We start with the default style of theme_minimal(). In addition, we assign the colors from RColorBrewer to an object col_srip. More information about the colors used here.
theme_strip <- function(){

  theme_minimal() %+replace%
  theme(
    axis.text.y = element_blank(),
    axis.line.y = element_blank(),
    axis.title = element_blank(),
    panel.grid.major = element_blank(),
    legend.title = element_blank(),
    axis.text.x = element_text(vjust = 3),
    panel.grid.minor = element_blank(),
    plot.title = element_text(size = 14, face = "bold"),
    legend.key.width = unit(.5, "lines")
  )
}

col_strip <- brewer.pal(11, "RdBu")

# all
brewer.pal.info
For the final graphic we use the geometry geom_tile(). Since the data does not have a specific value for the Y axis, we need a dummy value, here I used 1. Also, I adjust the width of the color bar in the legend.
maxmin <- range(temp_lisboa_yr$ta, na.rm = T)
md <- mean(temp_lisboa_yr$ta, na.rm = T)

ggplot(
  temp_lisboa_yr,
  aes(date, y = 1, fill = ta)
) +
  geom_tile() +
  scale_x_date(
    date_breaks = "6 years",
    date_labels = "%Y",
    expand = c(0, 0)
  ) +
  scale_fill_gradientn(colors = rev(col_strip), values = scales::rescale(c(maxmin[1], md, maxmin[2])),
                        na.value = "gray80") +
  labs(
    title = "LISBOA 1880-2018",
    caption = "Datos: GISS Surface Temperature Analysis"
  ) +
  coord_cartesian(expand = FALSE) +
  theme_strip()
In case we want to get only the strips, we can use theme_void() and the argument show.legend = FALSE in geom_tile() to remove all style elements. We can also change the color for the NA values, including the argument na.value = “gray70” in the scale_fill_gradientn() function.
ggplot(
  temp_lisboa_yr,
  aes(x = date, y = 1, fill = ta)
) +
  geom_tile(show.legend = FALSE) +
  scale_fill_gradientn(colors = rev(col_strip), values = scales::rescale(c(maxmin[1], md, maxmin[2])),
                        na.value = "gray80") +
  coord_cartesian(expand = FALSE) +
  theme_void()


