geographic data
Understanding the World
Recent Posts
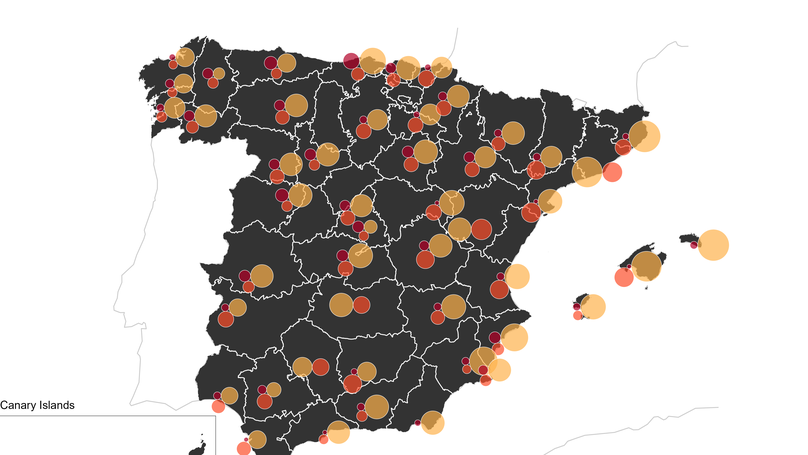
In my first post of 2024, which unfortunately has not been possible before April, I will explain how we can group in the same location several proportional circles. In 2022 I was looking for how to represent the number of heat wave days according to the degree of severity in Spain. I found the solution using the circle packing which is also used in the Dorling cartogram.
Publications
Graphs
About me
I am a climate scientist and actually, I am researcher and head of data science at the Climate Research Foundation (FIC), previously researcher at the University of Santiago de Compostela. I am originally from Grevenbroich, near by Cologne, in Germany. I graduated in Geography and Hispanic Philology at the University of Cologne and RWTH-Aachen University in 2010. After I met my wife in Galicia, I came to Santiago de Compostela, in northwest Spain, and made my Ph.D. in 2015 about the relationship between health and weather at the same University.
The main lines of research are, on the one hand, biometeorology and geographies of health, the relationship between human health and the atmospheric environment, and on the other hand, applied physical geography with a focus on atmospheric variables and their spatio-temporal behaviors.
I am an enthusiastic R user, with a lot of curiosity for spatial analysis, data visualizations, management and manipulation, and GIS.
I am a member of the Public Health Research Group at the University of Santiago de Compostela. In addition, I am a close collaborator of two other research groups, Geobiomet at the University of Cantabria and Climatology Group at the University of Barcelona. Since 2019 I am a member of the MCC Collaborative Research Network, an international research program on the associations between environmental stressors, climate, and health.
Feel free to contact me.
- applied climatology
- physical geography
- biometeorology
- public health
- geographic information systems
- R programming
- data management
- manipulation and visualization
-
PhD in Physical Geography, 2015
University of Santiago de Compostela, Spain
-
Geography and Hispanic Philology, 2010
University of Cologne | RWTH-Aachen University, Germany
